Calculate volumes between two DTMs
Drawing|Terrain|DTM Calculation
Terrain|DTM Calculation
The Volume model compares two digital terrain models with one another, or one model with a flat surface. The calculation is made using a grid and calculates the height differences between two models.
To calculate the volumes between a terrain model and a fixed surface you need
- A created terrain model (DTM) or a point cloud (.TPC)
- A level to calculate from.
- If required, polygons can be used to limit the area to be calculated.
To calculate volumes between two terrain models you need
- Two created digital terrain models (DTM) or point clouds (.TPC).
- If required, polygons can be used to limit the area to be calculated.
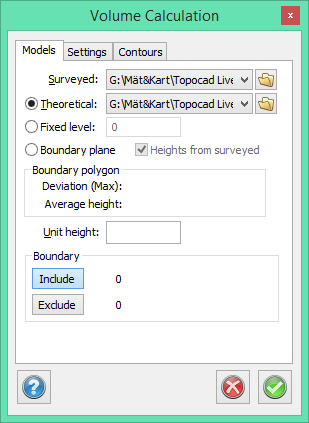
Explanation of the dialogue box
Surveyed (models)
Measured model or soil model.
Theoretical
Theoretical model or rock model. Bottom model.
Fixed level
It is possible to use a fixed level for calculations instead of a theoretical model.
Boundary plane
Draw a polygon around the height to be volume calculated. Select Boundary plane in the dialogue and then select the polygon in the drawing. Tick box Heights from surveyed to move the polygon up/down to the surveyed level.
Deviation: Indicates the deviation in height.
Average heights: The average height of the line.
Unit height
This calculates the volume and area for a model that is situated at [Unit height] below the theoretical (bottom) model.
Boundary
A polygon can be used to include or exclude any areas that should/should not be included in the calculation.
Contours
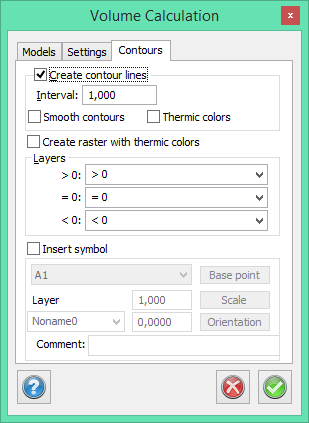
Selected if you want to calculate different contours. Enter a distance or interval between contours.
You can select smooth contours if required (see also contour lines).
Thermic colours can be created both on contour lines and as grids (polygon quadrates). We recommend that you do not mix too much here.
Layers
> 0 = the measured DTM is above the theoretical model (fixed surface)
0 = the intersection between the two models.
< 0 = the measured model is below the theoretical model.
Insert symbol
Tick box to insert a symbol. Select the symbol from the list.
Base point: Select Base point to position the symbol at any point. If no selection is made, the symbol will be placed in the middle.
Scale: Change the size of the symbol.
Orientation: Change the direction.
Layer: Select which layer the symbol should be placed in.
Comment: Add a comment.
If you have a symbol inserted, you can then choose to add a link to the report, as an attribute to the symbol.
Settings
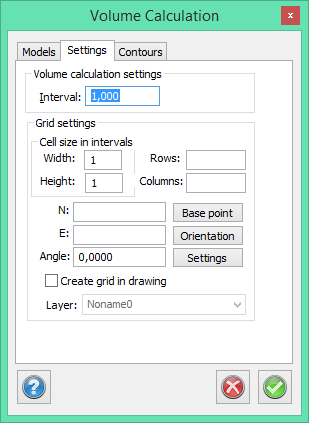
The accuracy of the calculation. The interval used to calculate the areas and volumes. The default value is 0.25 m which means that every m² is calculated using 16 points or distances. Reducing this value will slow down the calculation but produce a more accurate result.
Interval
4 is 4 meter
Grid settings
Cell size in intervals
Width, height: The side of the grid's square is (4) x width (5) = 20 meters in this example.
Rows, Columns: Enter the number of rows and columns. Leave blank to fill the entire drawing.
X, Y: Leave blank to begin the grid in the lower left corner.
Starting point: Click the starting point to set the grids starting point manually in the drawing.
Create grid in drawing: Leave blank to show only the squares in the report.
Settings
Select Settings button to open the following dialogue:
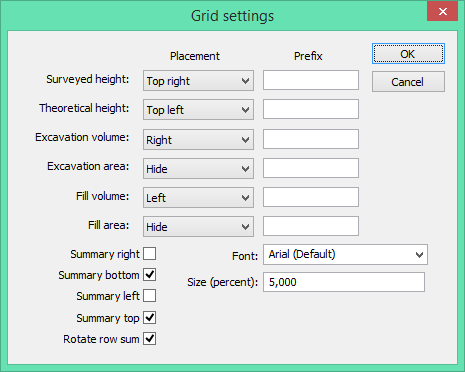
To place the values in the grid in the drawing, select from the options under Placement. To hide the values select Hide.
Enter a prefix for each value to help identify your different values.
Summary right: Check box to calculate the sum of each row and to print it at the right of the grid.
Summary bottom: Check box to calculate the sum of each column and to print it at the bottom of the grid.
Font: Select the font you want to use.
Create report
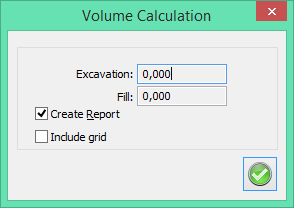
Select Include grid to add the volume calculation based on the grid in the report.
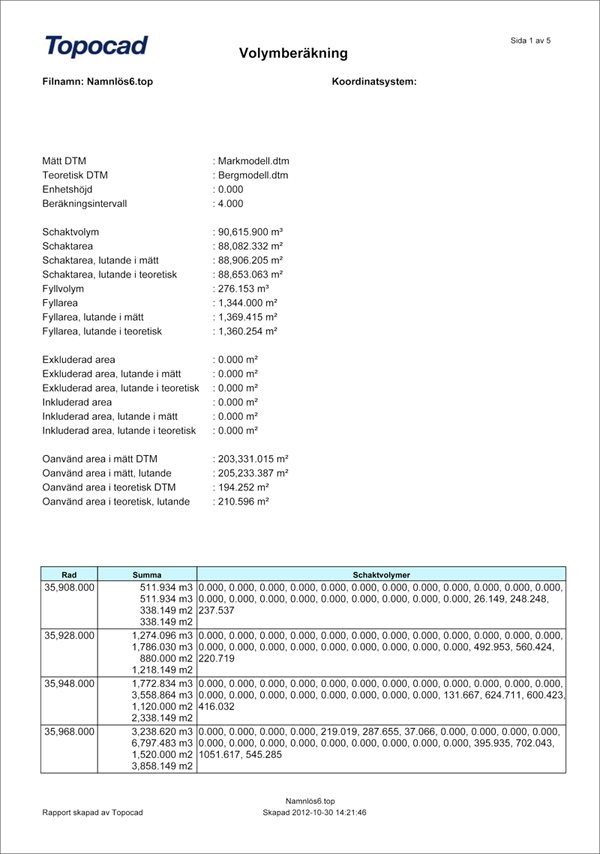
Report of volume calculation